






Before drawing a conclusion from a workplace chart, check what is measured, how the axes work and which records are included. A dramatic visual change can arise from the display or denominator rather than the work pattern the reader first assumes.
Use the original fictional examples below to practise asking questions. They are not statistics about Brisbane employment, the Games or a real organisation.

Read the title, units and source
Identify the measure, period, population or dataset and source. Check whether the chart shows a count, percentage, rate, total or average. Those measures can tell different stories about the same work.
Ask whether the records are complete and comparable across periods. A shorter reporting period or a changed definition can make a difference appear meaningful when the basis has changed.
If a source or definition is missing, record the question before repeating the chart’s conclusion in a report.
Inspect the axes and intervals
Check the starting value, scale, units and spacing. An axis beginning close to the values can make a small difference look large. A different scale can reduce the visible difference.
For a bar chart, readers compare bar lengths, so a non-zero baseline can exaggerate differences. A line chart may use a narrower range to show change, but its scale still needs to be clear. Consider whether the display is suitable for the chart type and question. The aim is to interpret the values accurately, not to apply one visual rule without understanding the measure.
Compare time intervals and category widths where relevant. Equal spacing can mislead if it represents unequal periods without making that clear.
A percentage example
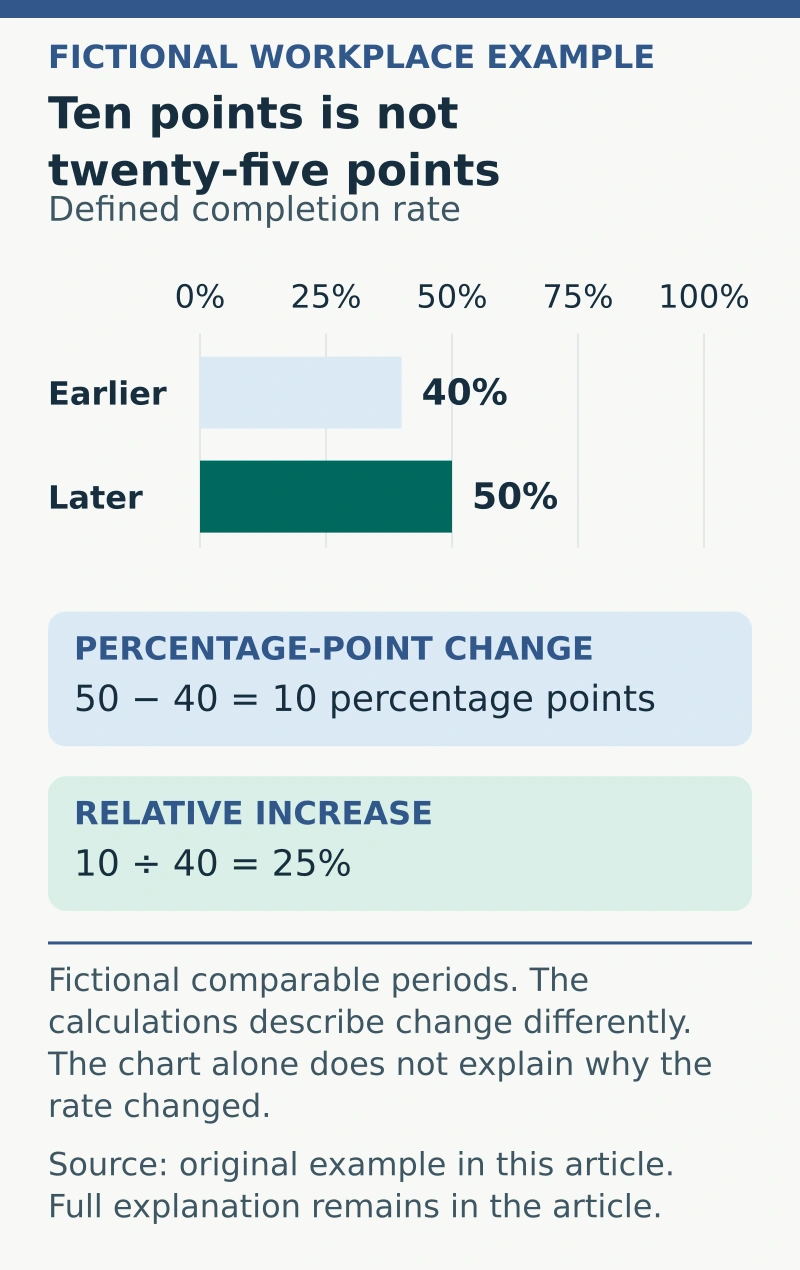
In this invented scenario, a defined completion rate changes from 40% to 50%, measured on a comparable basis. The difference is ten percentage points. Relative to the original 40%, the increase is 25%, because ten divided by forty equals 0.25.
Both statements can be mathematically correct, but they describe the change differently. “Up 25%” should not be rewritten as an increase of twenty-five percentage points.
Check the underlying counts too. A percentage based on a very small number of records may change sharply when one record changes.
Use a chart-reading record
Ask:
- Measure: what exactly is being counted or calculated?
- Scope: which people, items, locations or periods are included?
- Units: count, amount, percentage, rate or another defined measure?
- Display: axes, scale, intervals and labels?
- Comparability: definitions and collection methods consistent?
- Missing information: excluded records, uncertainty or unresolved data quality?
- Claim: what conclusion is supported and what remains an interpretation?
Do not infer a cause from two measures moving together. Consider other changes and evidence needed before describing an intervention as the reason for a result.
Write a proportionate conclusion
An appropriate fictional summary might say, “The defined rate rose from 40% to 50% over the two comparable periods. The chart alone does not explain why.” Add relevant context and uncertainty rather than inventing a cause. If you use a fictional chart exercise in an interview, our interview-preparation guide can help you explain what you checked and what the evidence did not establish, rather than reporting only the headline number.
The Australian Bureau of Statistics provides statistical literacy information for understanding and using data. Consult the actual measure’s documentation and appropriate analytical expertise when a decision needs more than a visual reading.
A useful chart interpretation preserves the measure, comparison and limits, allowing another person to check the conclusion against the underlying information.